Performance Optimisation and Productivity Audits
The Performance Optimisation and Productivity Centre of Excellence POP CoE in Computing Applications provides performance optimisation and productivity services for academic and industrial code(s) in all domains. In the POP analyst training on 18-21 Mar. 2019 at JSC (Jülich Supercomputing Centre), an HPC application was analyzed by Scalasca as well as Paraver workflow. We detail the HPC code in performance metric, scalability, and parallel efficiency via following structure.
Background
Test-case description: The Lattice Boltzmann Method (LBM) based on a BGK model is used to solve a computational domain generated with a local refinement method at the boundaries. The total number of cells is ca. 50 mil. The application performance is measured in 100 time steps on 2 node (48 cores per node) which yields a global workload imbalance 0.000983516%.
Machine description: JUWELS (Jülich Wizard for European Leadership Science) consists of the 2271 standard and the 240 large-memory nodes each of which possesses 48 cores of the Dual Intel Xeon Platinum 8168 processors. The application is running under the Slurm (Simple Linux Utility for Resource Management) Workload Manager, a free open-source batch system. The resource on JUWELS is managed by the ParaStation process management daemon.
Compile software: GCC/8.2.0, ParaStationMPI/5.2.1-1, parallel-netcdf/1.10.0, FFTW/3.3.8, CMake/3.13.0
module load GCC/8.2.0 ParaStationMPI/5.2.1-1 pscom/5.2.9-1 parallel-netcdf/1.10.0 FFTW/3.3.8 CMake/3.13.0
Analysis tools: Score-P/4.1, Scalasca/2.4, PAPI/5.6.0, Vampir/9.5.0, Extrae/3.6.1, Paraver/4.8.1
Note: Score-P instrument with a runtime filtering collected the hardware counters PAPI_TOT_CYC, PAPI_TOT_INS, PAPI_RES_STL.
export SCOREP_METRIC_PAPI=PAPI_TOT_INS,PAPI_TOT_CYC,PAPI_RES_STL
Application name: ZFS (Zonal Fluid Solver)
Programming language: C++
Programming model: MPI + OpenMP
Source code available: yes
Input data: Amazing Fluid Dynamics
Performance study: Overall performance of Lattice Boltzmann Method (LBM) module and porting to GPU accelerator
Support activities
Under the SiVeGCS project (SiVeGCS is an acronym for “Koordination und Sicherstellung der weiteren Verfügbarkeit der Supercomputing Ressourcen des GCS im Rahmen der nationalen Höchstleistungsrechner-Infrastruktur”) the action is defined to support the supercomputer users such that the coordination of the high-performance computing (HPC) resources of the Gauss Centre for Supercomputing (GCS) successfully ensures the availability in the framework of the national HPC infrastructure. The main objective of this national project pursues the world class systems for science, economy, society, and politics. The results achieved in the detailed actions can be exploited and transferred to the national communities to increase the outreach to the general public. To realized these primary aims, the user projects are supported by the efficient and the effective methods which include the communication with the Jülich Supercomputing Centre (JSC) supporting team, the technical consulting, and the national and the international cooperation.
Developer
In this reporting a performance measurement is presented for the ZFS (Zonal Fluid Solver) developed by the Institute of Aerodynamics at the RWTH Aachen University, Germany (AIA). The SimLab Highly Scalable Fluids & Solids Engineering (SLFSE) performs to support in the fields of engineering science the users experienced in massively parallel systems regarding high scalability, memory optimization, programming of hierarchic computer architectures, and performance optimization on computer nodes.
Application structure
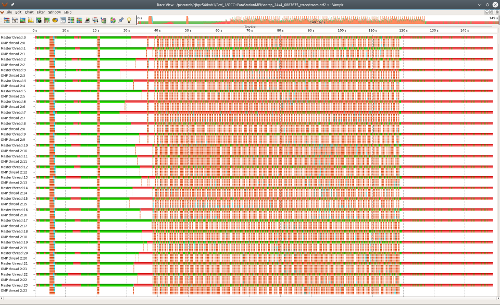

The trace result of Scalasca analysis is illustrated for 24 MPI ranks with 4 threads using Vampir.
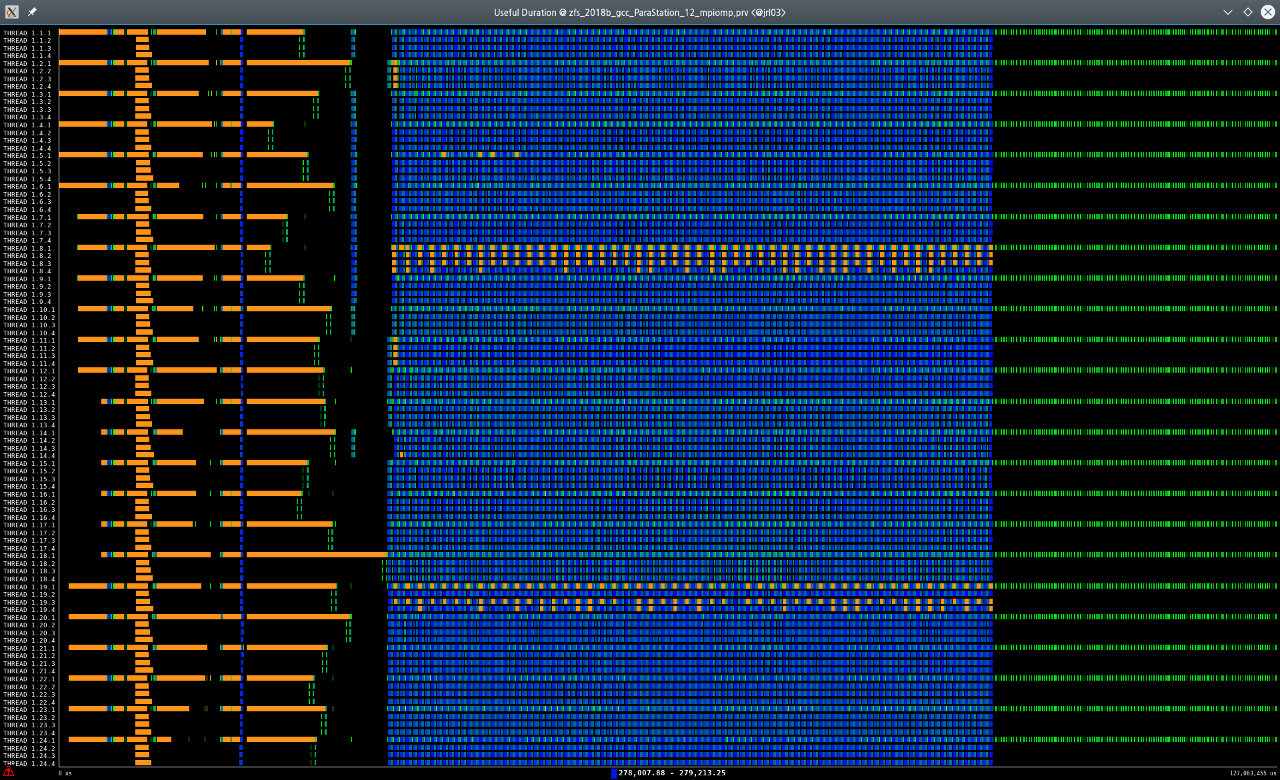
This figure shows a Paraver timeline for the same simulation setup. The master threads has a little synchronization time in the initialization and the file IO at the beginning and the termination of the program. The OMP threads are ativated during the main iterations colored in blue.

The timeline of two MPI ranks in ten iterations. Colors indicate the state at idle (black), running (blue), waiting a message (red), scheduling and fork/join (yellow), wait/wait all (crimson), and immediate send (pink).

The timeline of MPI calls for two MPI ranks in ten iterations.
Focus of analysis
Scalability information
Unfortunately in this training course we could not perform the full scale analysis. For the full scalability analysis on the JUWELS the ZFS needs computer resources which would be provided in the next Optimization & Scaling Workshop. Nevertheless, in the former Scaling Workshop on JUQUEEN the DG (Discontinuous Galerkin method) module was scaled up to 28672 nodes as shown in this figure.

The further information is available on the ZFS page of the JSC High-Q club.
Application efficiency
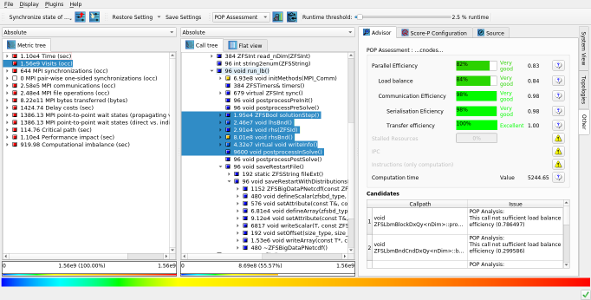
Performance metric - structure (call tree) - system resource analyzed by Scalasca
The pure MPI setup achieves using a Score-P instrument the following scores for the main functions selected in the call-tree.
- Parallel efficiency 83%
- Load balance 84%
- Communication efficiency 98%
- Serialization efficiency 98%
- Transfer efficieny 100%
Load balance
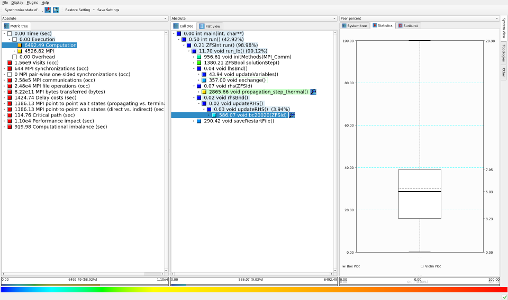
A large disparity in the computation load occurs at the function call which calculates the boundary condition of no-slip wall. The local values at the boundary edges are updated at each time step for their physical conditions implemented by numerical schemes.
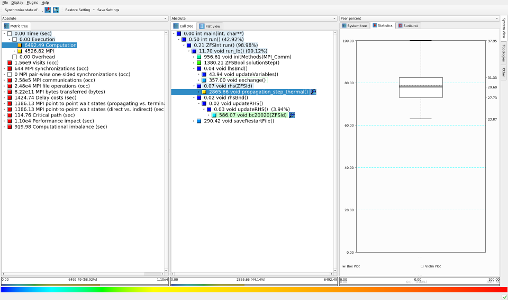
This figure illustrates that the computation of the main function accounts for ca. 40% of the computing time with a mean computing time 29.6s per MPI rank.